Local authority methodology
Introduction
When policy changes in the UK - taxes, benefits, or public spending - it affects places and people differently. PolicyEngine UK builds tools to analyze incomes, jobs, and population patterns in each local authoirity district. This documentation explains how we create a microsimulation model that works at the local authoirity level. The system combines workplace surveys of jobs and earnings, HMRC tax records, and population statistics. We estimate income distributions, and optimize geographic weights.
This guide shows how to use PolicyEngine UK for local authoirity analysis. We start with data collection, transform it for modeling, and build tools to examine policies. The guide provides examples and code to implement these methods. Users can measure changes in household budgets, track employment, and understand economic patterns on different local authoirity districts. This document starts with data collection from workplace surveys, tax records, and population counts, then explains how we convert this data into usable forms through income brackets. It concludes with technical details about accuracy measurement and calibration, plus example code for analysis and visualization.
Data
In this section, we describe three main data sources that form the foundation of our local authority level analysis: earning and jobs data from NOMIS ASHE, income statistics from HMRC, and population age distributions from the House of Commons Library.
Earning and jobs data
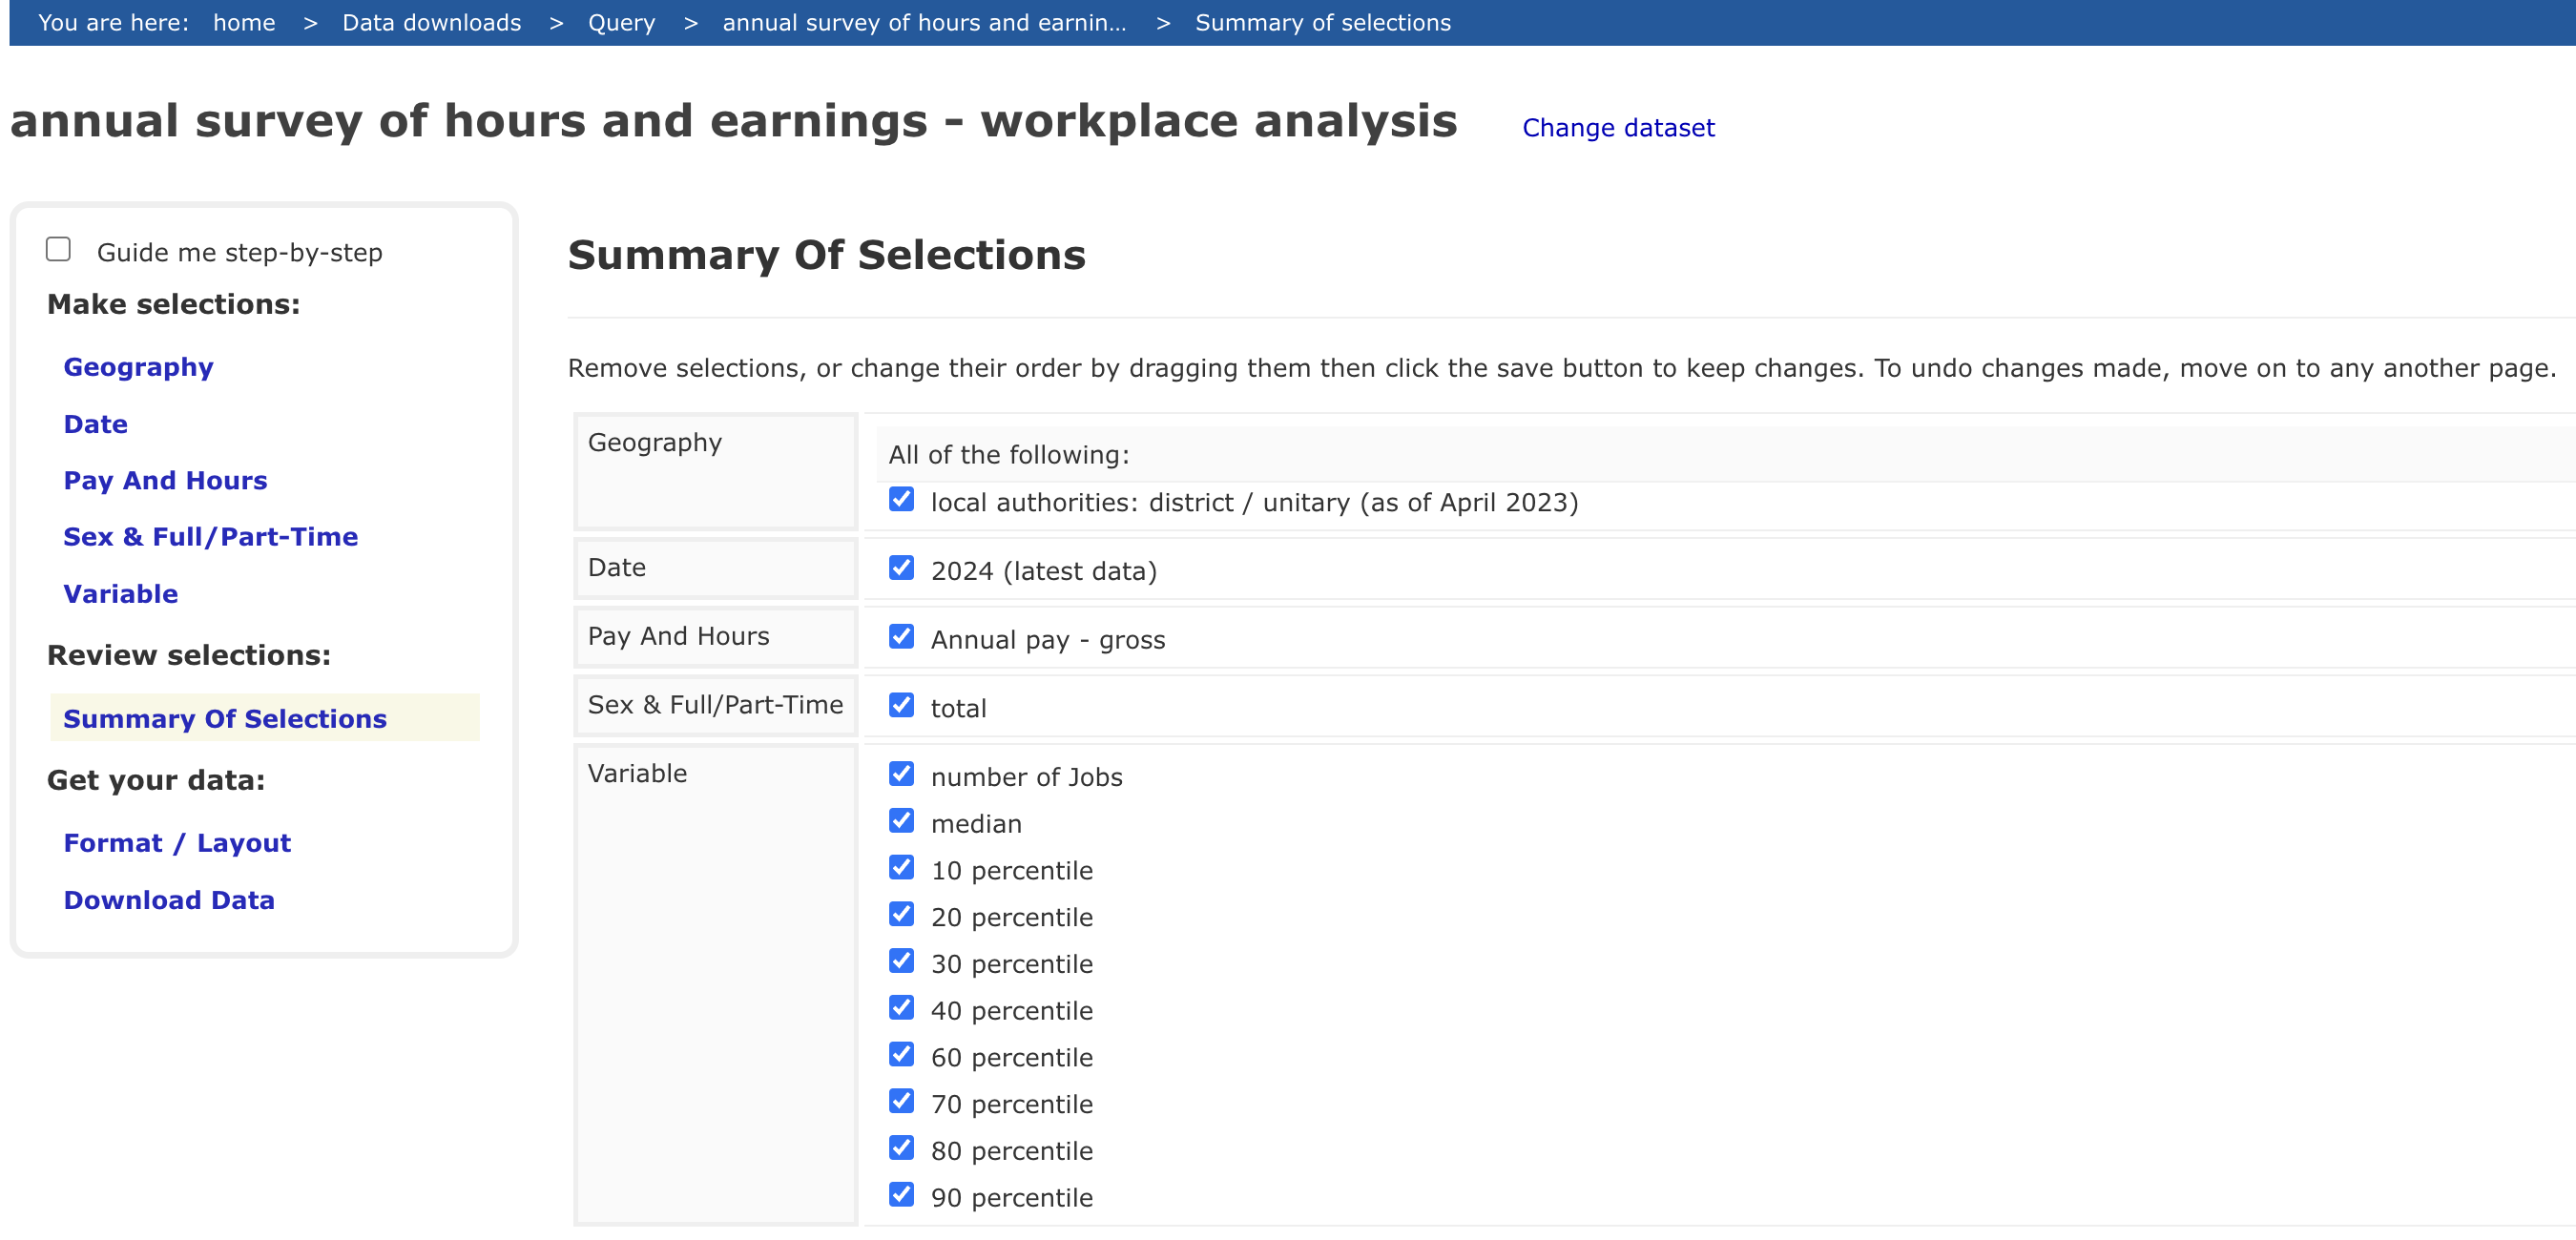
Data is extracted from NOMIS Annual Survey of Hours and Earnings (ASHE) - workplace analysis dataset, containing number of jobs and earnings percentiles for all UK local authority districts from the NOMIS website. This dataset is stored as nomis_earning_jobs_data.xlsx. To download the data, follow the variable selection process shown in the image below:
Income data
Income data for UK local authorities is obtained from HMRC. This dataset provides detailed information about income and tax by local authorities with confidence intervals, and is stored as total_income.csv, including two key variables:
total_income_count: the total number of taxpayers in each local authoritytotal_income_amount: the total amount of income for all taxpayers in each local authority
We use these measures to identify similar local authorities when employment distribution data is missing. Our approach assumes that local authorities with similar income patterns (measured by both taxpayer counts and total income) will have similar earnings distributions. The following table shows the dataset:
| code | name | total_income_count | total_income_amount |
|---|---|---|---|
Loading ITables v2.3.0 from the init_notebook_mode cell...
(need help?) |
Population data by age
Population data by age groups for UK local authorities can be downloaded from the ONS data dashboard. The dataset provides detailed age breakdowns for each UK local authority, containing population counts for every age from 0 to 90+ years old across all local authorities in England, Wales, Northern Ireland, and Scotland. The data is stored as age.csv. The following table shows the dataset:
| code | name | all | 0 | 1 | 2 | 3 | 4 | 5 | 6 | 7 | 8 | 9 | 10 | 11 | 12 | 13 | 14 | 15 | 16 | 17 | 18 | 19 | 20 | 21 | 22 | 23 | 24 | 25 | 26 | 27 | 28 | 29 | 30 | 31 | 32 | 33 | 34 | 35 | 36 | 37 | 38 | 39 | 40 | 41 | 42 | 43 | 44 | 45 | 46 | 47 | 48 | 49 | 50 | 51 | 52 | 53 | 54 | 55 | 56 | 57 | 58 | 59 | 60 | 61 | 62 | 63 | 64 | 65 | 66 | 67 | 68 | 69 | 70 | 71 | 72 | 73 | 74 | 75 | 76 | 77 | 78 | 79 | 80 | 81 | 82 | 83 | 84 | 85 | 86 | 87 | 88 | 89 | 90+ |
|---|---|---|---|---|---|---|---|---|---|---|---|---|---|---|---|---|---|---|---|---|---|---|---|---|---|---|---|---|---|---|---|---|---|---|---|---|---|---|---|---|---|---|---|---|---|---|---|---|---|---|---|---|---|---|---|---|---|---|---|---|---|---|---|---|---|---|---|---|---|---|---|---|---|---|---|---|---|---|---|---|---|---|---|---|---|---|---|---|---|---|---|---|---|
Loading ITables v2.3.0 from the init_notebook_mode cell...
(need help?) |
Preprocessing
In this section, we detail a preprocessing step necessary for our local authority level analysis: converting earnings percentiles into practical income brackets.
Convert earning percentiles to brackets
To analyze earnings data effectively, we convert earning percentiles into earning brackets through the following process:
First, we estimate the full distribution of earnings by:
Using known percentile data (10th to 90th) from the ASHE dataset
Extending this to estimate the 90th-99th percentiles using ratios derived from this government statistics report
This estimation allows us to map earnings data into brackets that align with policy thresholds.
After estimating the full earnings distribution, we convert the data into income brackets. We calculate the number of jobs and total earnings for each local authority and income bracket based on the estimated earnings distribution. When we encounter local authorities with missing data, we estimate their earnings distribution pattern using data from local authorities with similar total number of taxpayers and total income levels.
The script create_employment_incomes.py generates employment_income.csv containing number of jobs (employment_income_count) and total earnings (employment_income_amount) for each local authority and income bracket. The following table shows employment and income across different brackets for local authorities:
| code | name | employment_income_lower_bound | employment_income_upper_bound | employment_income_count | employment_income_amount |
|---|---|---|---|---|---|
Loading ITables v2.3.0 from the init_notebook_mode cell...
(need help?) |
Methodology
This section describes our approach to creating accurate local authority level estimates through three key components: a loss function for evaluating accuracy, a calibration process for optimizing weights, and the mathematical framework behind the optimization. To see how well this methodology performs in practice, you can check our detailed validation results page comparing our estimates against actual data at both local authority and national levels.
Loss function
The file loss.py defines a function create_local_authority_target_matrix that creates target matrices for comparing simulated data against actual local authority level data. The following process outlines how the function processes:
Takes three main input parameters: dataset (defaults to
enhanced_frs_2022_23), time_period (defaults to 2025), and an optional reform parameter for policy changes.Reads three files containing real data:
age.csv,total_income.csv, andemployment_income.csv.Creates a PolicyEngine Microsimulation object using the specified dataset and reform parameters.
Creates two main matrices:
matrixfor simulated values from PolicyEngine, andyfor actual target values from both HMRC (income data) and ONS (age data).Calculates total income metrics at the national level, computing both total amounts and counts of people with income.
Processes age distributions by creating 10-year age bands from 0 to 80, calculating how many people fall into each band.
Processes both counts and amounts for different income bands between £12,570 and £70,000, excluding people under 16 for employment income.
Maps individual-level results to household level throughout the
sim.map_result()function.The function returns both the simulated matrix and the target matrix
(matrix, y)which can be used for comparing the simulation results against actual data.
Calibration function
The file calibrate.py defines a main calibrate() function that performs weight calibration for local authority level analysis.
It imports necessary functions and matrices from other files including
create_local_authority_target_matrix,create_national_target_matrixfromloss.py.Sets up initial matrices using the
create_local_authority_target_matrixandcreate_national_target_matrixfunctions for both local authority and national level data.Creates a Microsimulation object using the
enhanced_frs_2022_23dataset.Initializes weights for 360 local authority districts x 100180 households, starting with the log of household weights divided by local authority district count.
Converts all the matrices and weights into PyTorch tensors to enable optimization.
Defines a loss function that calculates and combines both local authority level and national-level mean squared errors into a single loss value.
Uses Adam optimizer with a learning rate of 0.1 to minimize the loss over 512 epochs.
Every 100 epochs during optimization, it updates the weights and saves the current weights to a
weights.h5file.
Optimization mathematics
In this part, we explain the mathematics behind the calibration process that we discussed above. The optimization uses a two-part loss function that balances local authority level and national-level accuracy, combining both local and national targets into a single optimization problem. The mathematical formulation can be expressed as follows:
For the local authority level component, we have:
A set of households (\(j\)) with known characteristics (\(metrics_j\)) like income, age, etc.
A set of local authorities (\(i\)) with known target values (\(y_c\)) from official statistics
Weights in log space (\(w_{ij}\)) that we need to optimize for each household in each local authority
Using these components, we calculate predicted local authority level statistics. For each local authority metric (e.g. total income), the predicted value is:
where \(\text{metrics}_j\) represents the household-level characteristics for that specific metric (e.g. household income). We use exponential of weights to ensure they stay positive.
To measure how well our predictions match the real local authority data, we calculate the local authority mean squared error:
where \(y_c\) are the actual target values from official statistics for each local authority. We use relative error (dividing by \(1 + y_c\)) to make errors comparable across different scales of metrics.
For the national component, we need to ensure our local authority level adjustments don’t distort national-level statistics. We aggregate across all local authorities:
with corresponding mean squared error to measure deviation from national targets:
The total loss combines both local authority and national errors:
We initialize the weights using the original household weights from the survey data:
where 650 is the number of local authorities. These weights are then iteratively optimized using the Adam (Adaptive Moment Estimation) optimizer with a learning rate of 0.1. The optimization process runs for 512 epochs, with the weights being updated in each iteration:
This formulation ensures that the optimized weights maintain both local local authority at the local authority level and global accuracy for national-level statistics. The Adam optimizer adaptively adjusts the weights to minimize both local authority level and national-level errors simultaneously, providing efficient convergence through adaptive learning rates and momentum. The resulting optimized weights allow us to accurately reweight household survey data to match both local authority level and national statistics to obtain accurate estimates of income distributions, demographics, and policy impacts for each parliamentary local authority while maintaining local authority with national totals.